Companies use three main financial statements to record and report the financial representation of their operations and activities. These three financial statements are the balance sheet, the income statement, and the cash flow statement. This article focuses on balance sheet vs income statement.
The balance sheet and income statement are prepared from journal entries and financial records generated in carrying out the operations of a business. They are useful and important financial documents that differ in many ways but are used as complementary documents for analyzing a company.
What is a Balance Sheet?
A balance sheet is a financial statement that shows the financial picture of a company at a point in time. Usually, a balance sheet is created every fiscal quarter and at the company’s fiscal reporting year-end. Financial transactions that impact a company’s assets, liabilities, and shareholders’ equity are recorded and rolled up into a balance sheet.
A balance sheet comprises three major components, the assets owned by the company, the liabilities owed by the business, and the shareholders’ equity which shows ownership in the company.
Assets
The assets on your balance sheet statement show what your company owns at a specific point in time. Assets are classified as current or non-current. Current assets are assets that can be quickly converted into cash. Examples of current assets include cash and cash equivalent, inventory, accounts receivable. Non-current assets, on the other hand, are typically long-term assets in nature and cannot be easily converted to cash. Examples of non-current assets are land and buildings, equipment, amongst others.
Liabilities
Your company’s liabilities are what your company owes to lenders and vendors. Like assets, your company’s liabilities can be classified as current or non-current.
Shareholders’ Equity
The shareholders’ equity shows how much the owners of the company have invested in the company. This typically includes owners’ capital and retained earnings re-invested in the company.
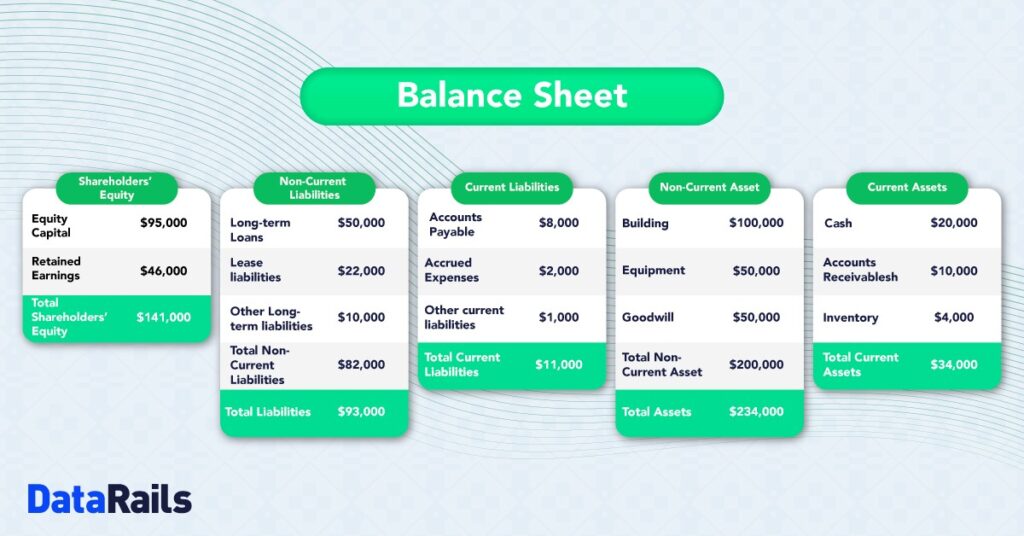
A simple balance sheet sample is shown below:

The Balance Sheet Equation: Shareholders Equity = Total Assets – Total Liabilities
Using the balance sheet sample above:
Shareholders Equity = $234,000 – $93,000
= $141,000
What is an Income Statement?
An income statement is a financial document that shows how much revenue your company has made in a period and how much expenses were incurred to generate this revenue. A company’s income statement shows the company’s overall profitability and how much income was made at the end of a period. Like the balance sheet, companies prepare the income statement for their fiscal quarter ends and year ends.
An income statement is also called a profit and loss statement (P&L). It is a financial report that shows the following:
Sales
The sales generated by your company are determined by the quantity of goods or services sold and the price of your goods and services. If your company makes a lot of sales, or the prices of your goods or services increase, this can increase your total sales.
Cost of Goods/Services Sold
The cost of goods sold is a combination of the labor and materials used to produce the goods and services that your company sells to customers. These are expenses used directly for the production of goods and services.
Gross Profit
Your company’s gross profit is derived by deducting the direct cost of goods and services sold from the net sales generated.
Operating Expenses
Indirect business expenses that are not used to produce goods and services make up the operating expenses. Operating expenses include selling costs, administrative expenses, research, and development costs, rent, indirect logistics expenses, salaries, and other general expenses incurred.
Operating Income
Your company’s operating income is also referred to as an operating profit. This is the income that has been generated over the expenses incurred as a result of running your business. Your operating income is derived by deducting your company’s operating expenses from the gross profit made in the reporting period.
Income Before Tax
The income before tax is the total operating income plus any other income earned that is not directly related to your company’s operations, less any other expenses. Your net income is generally referred to as income before tax and determines how much tax you will pay for the reporting period.
A simple income statement sample is shown below:
| Income Statement | |
| Sales | $100,000 |
| Costs of Goods Sold | ($40,000) |
| Gross Profit | $60,000 |
| Operating Expenses: | |
| Salary | $10,000 |
| Rent | $2,000 |
| Administrative | $500 |
| General | $500 |
| Total Operating Expenses | ($13,000) |
| Operating Income | $47,000 |
| Other Income/(Expenses) | $(5,000) |
| Income Before Tax | $42,000 |
| Income Tax | ($12,600) |
| Income After Tax | $29,400 |
Balance Sheet vs Income Statement – Differences
While the balance sheet and income statement complement each other, they differ and serve varying purposes for companies and external stakeholders. Some differences between a balance sheet and an income statement are shown below.
| Balance Sheet | Income Statement |
| Shows the assets that a company owns at a point in time. | Shows the revenue and profits generated by a company over a period. |
| Shows the vendor liabilities that a company has in accounts payable. | Records expenses and costs incurred in running a business. |
| The shareholders’ equity on a balance sheet shows ownership in a company. | The income statement shows how much net income is distributed as dividends to shareholders or plowed back into the business as retained earnings. |
| Shows tax payable as liabilities. | Shows income taxes on earnings made in a period. |
| Reveals the debt and loans that a company has. | Shows any loan interests expenses for the period. |
| Shows the financial position of a company at a given time. | Shows the profitability of a company over a period of time. |
| The balance sheet reports assets, liabilities, and shareholders’ equity. | The income statement reports revenue, expenses, and profit. |
| Used by creditors to analyze how much a company owns and how much current assets can cover current liabilities. | Used by creditors and external stakeholders to analyze if the company makes adequate sales to cover expenses. |
In summary, the main differences between a balance sheet and the income statement are:
● Usage: The balance sheet can be used to analyze a company’s financial position, while an income statement is used to analyze the performance of a company.
● Timing: The balance sheet shows a company’s financial records at a point in time, while the income statement shows financial performance over a period of time.
● Reporting: The balance sheet reports assets, liabilities, and shareholders’ equity, while the income statement reports revenue, expenses, and profits.
Vertical Analysis Using the Balance Sheet and the Income Statement
The balance sheet and the income statement may have differences, but they can be jointly used to analyze the overall health of a company. One way to analyze a company’s performance is by carrying out a vertical analysis on the balance sheet and the income statement.
A vertical analysis involves creating ratios and percentages for each line item in a financial statement using a baseline item. The ratios calculated in a vertical analysis allow FP&A analysts to compare a company’s performance across different periods and the performance of various companies in the same period.
Vertical Analysis on the Balance Sheet
The vertical analysis on a balance sheet can be done using the total assets as a baseline. Using the balance sheet statement above, vertical analysis ratios can be calculated as follows:
Cash % Total Assets = $20,000/$234,000 = 8.5%
Current Assets % Total Assets = $34,000/$234,000 = 14.5%
Non-current Assets % Total Assets = $200,000/$234,000 = 85.4%
Vertical Analysis on the Income Statement
When carrying out a vertical analysis on an income statement, the total revenue is usually used as the baseline item to derive incomes statement ratios. Using the income statement sample above, vertical analysis ratios that can be calculated include:
Gross Profit % Sales = $60,000/$100,000 = 60%
Operating Profit % Sales = $47,000/$100,000 = 47%
Operating Expenses % Sales = $13,000/$100,000 = 13%
Net Income % Sales = $42,000/$100,000 = 42%
Conclusion
The balance sheet and income statement are important financial statements that can be used by financial analysts, internal management, and external stakeholders to analyze how a company is performing over time. The balance sheet shows the company’s assets, liabilities, and shareholders’ equity at a given point in time, while the income statement shows how the company performed over a specific period.