Data storytelling isn’t just a buzzword. It’s how finance makes an impact.
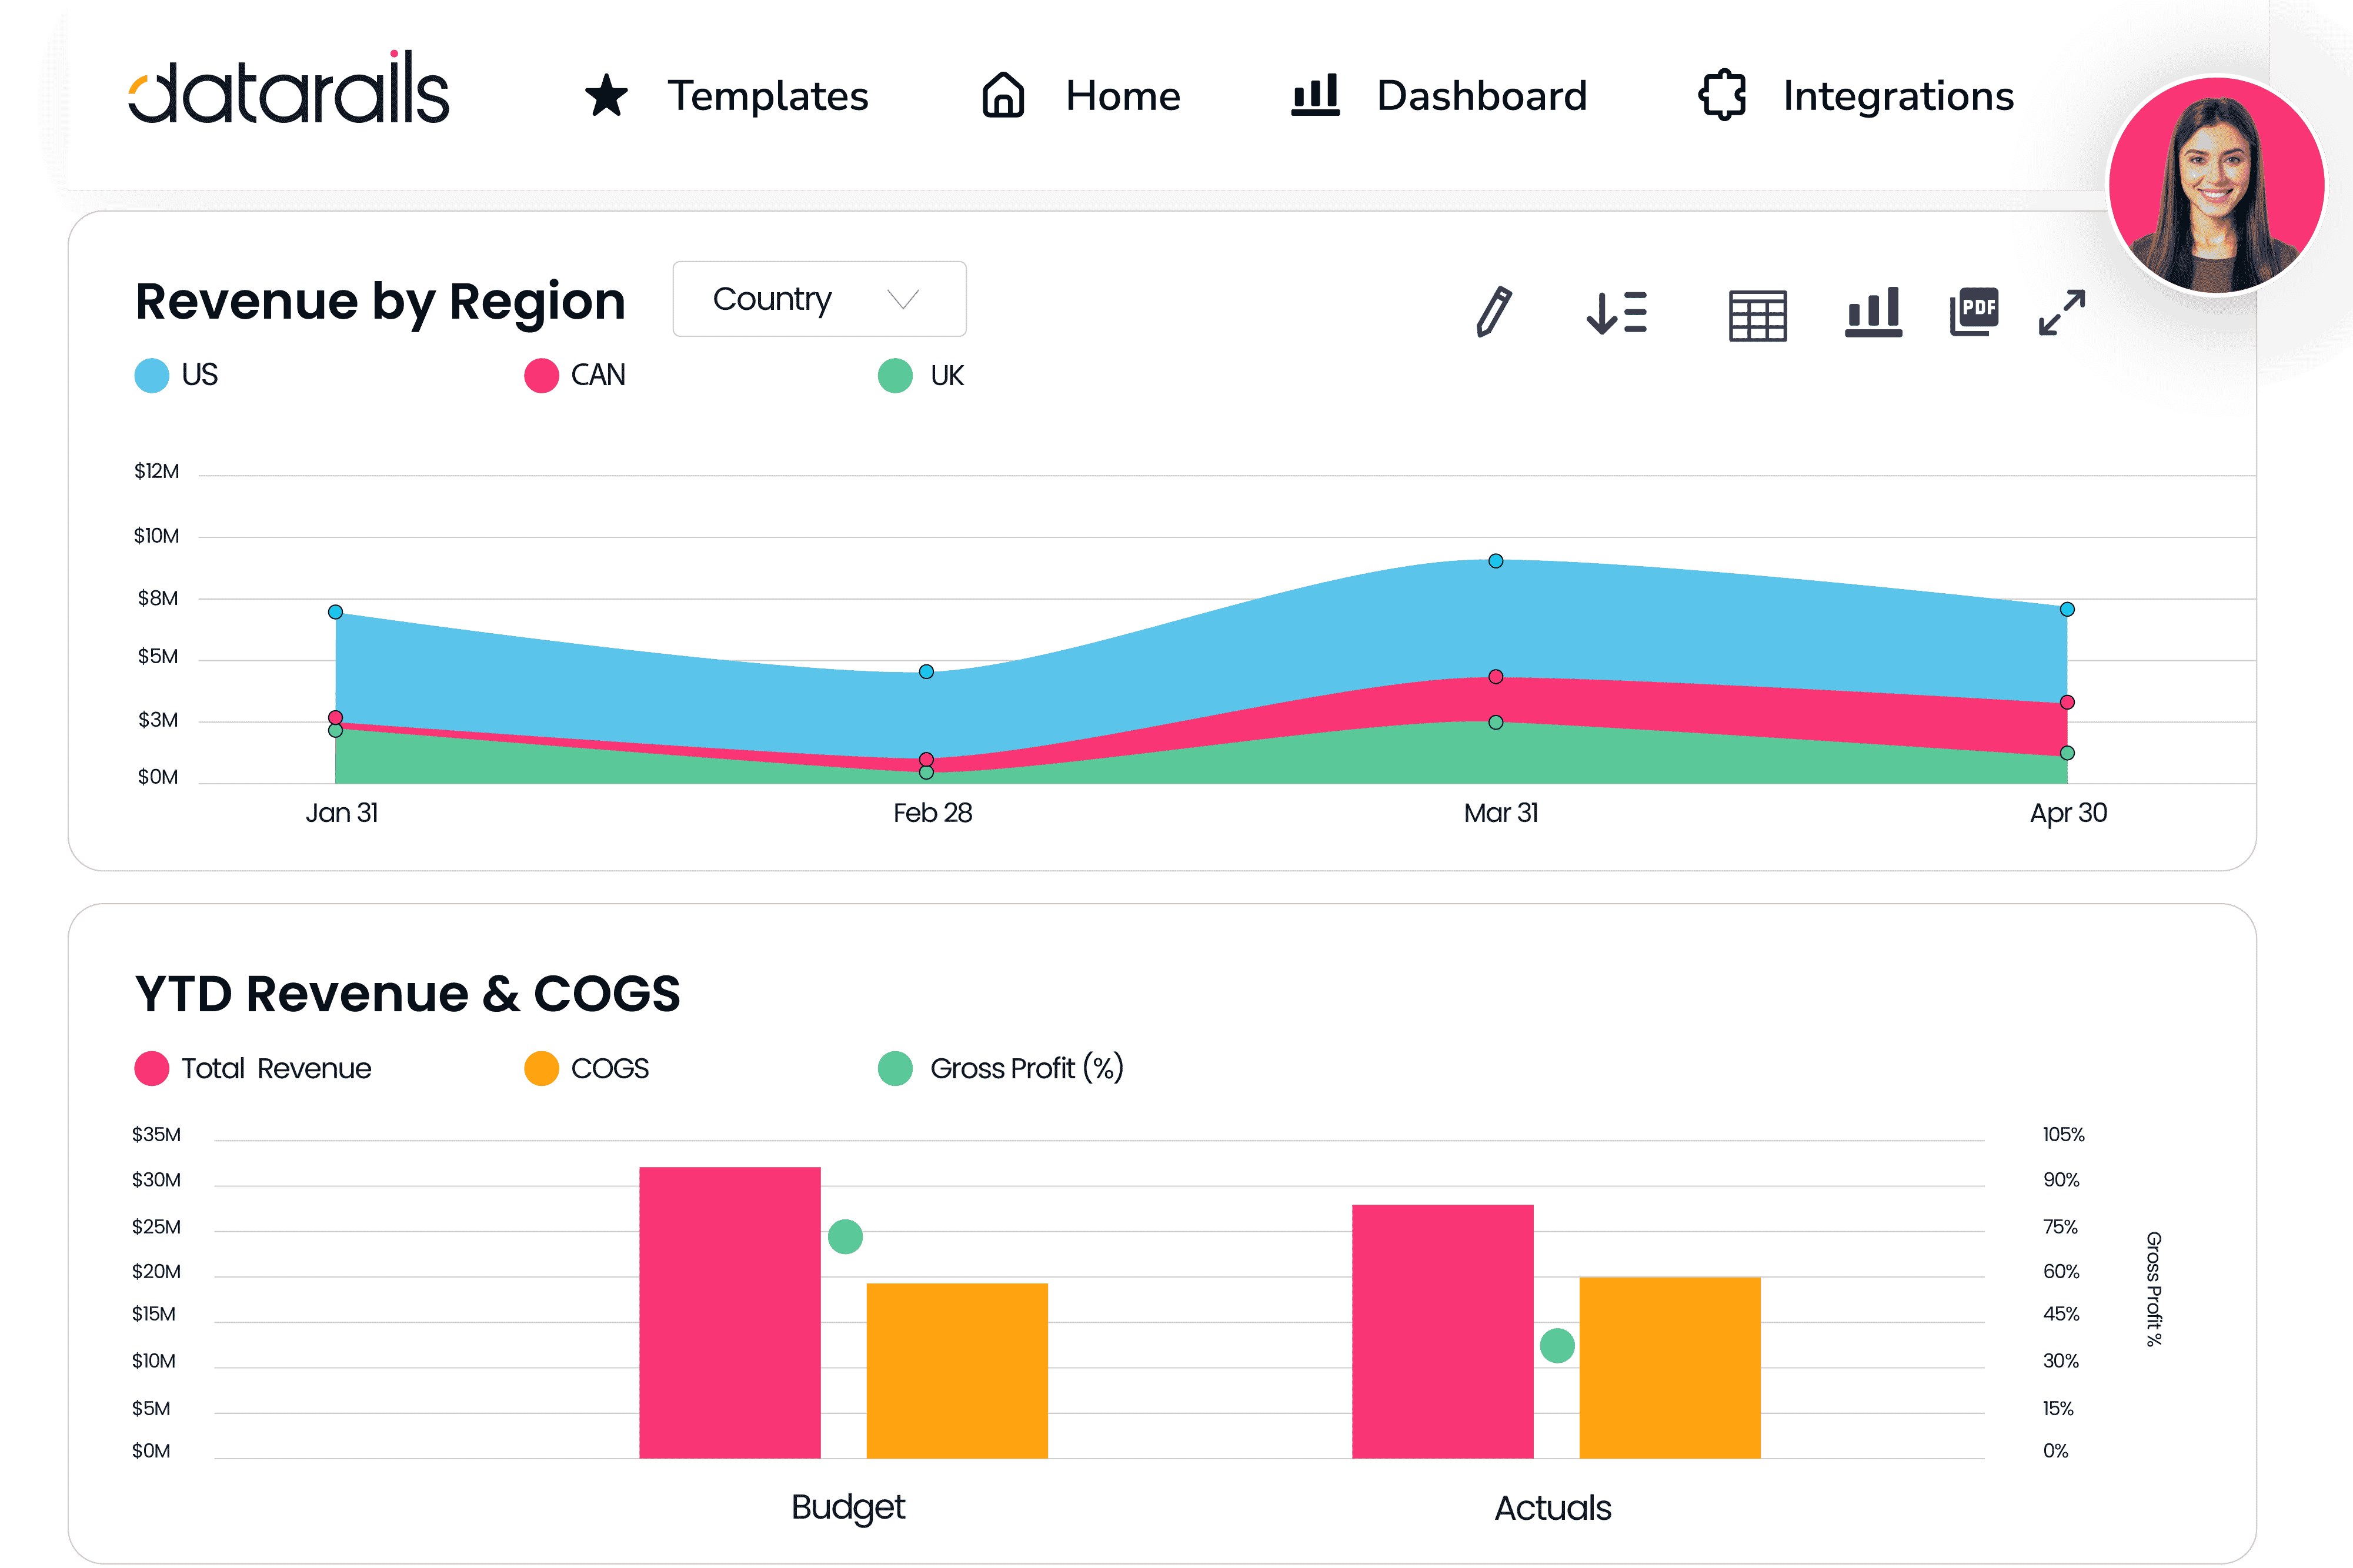
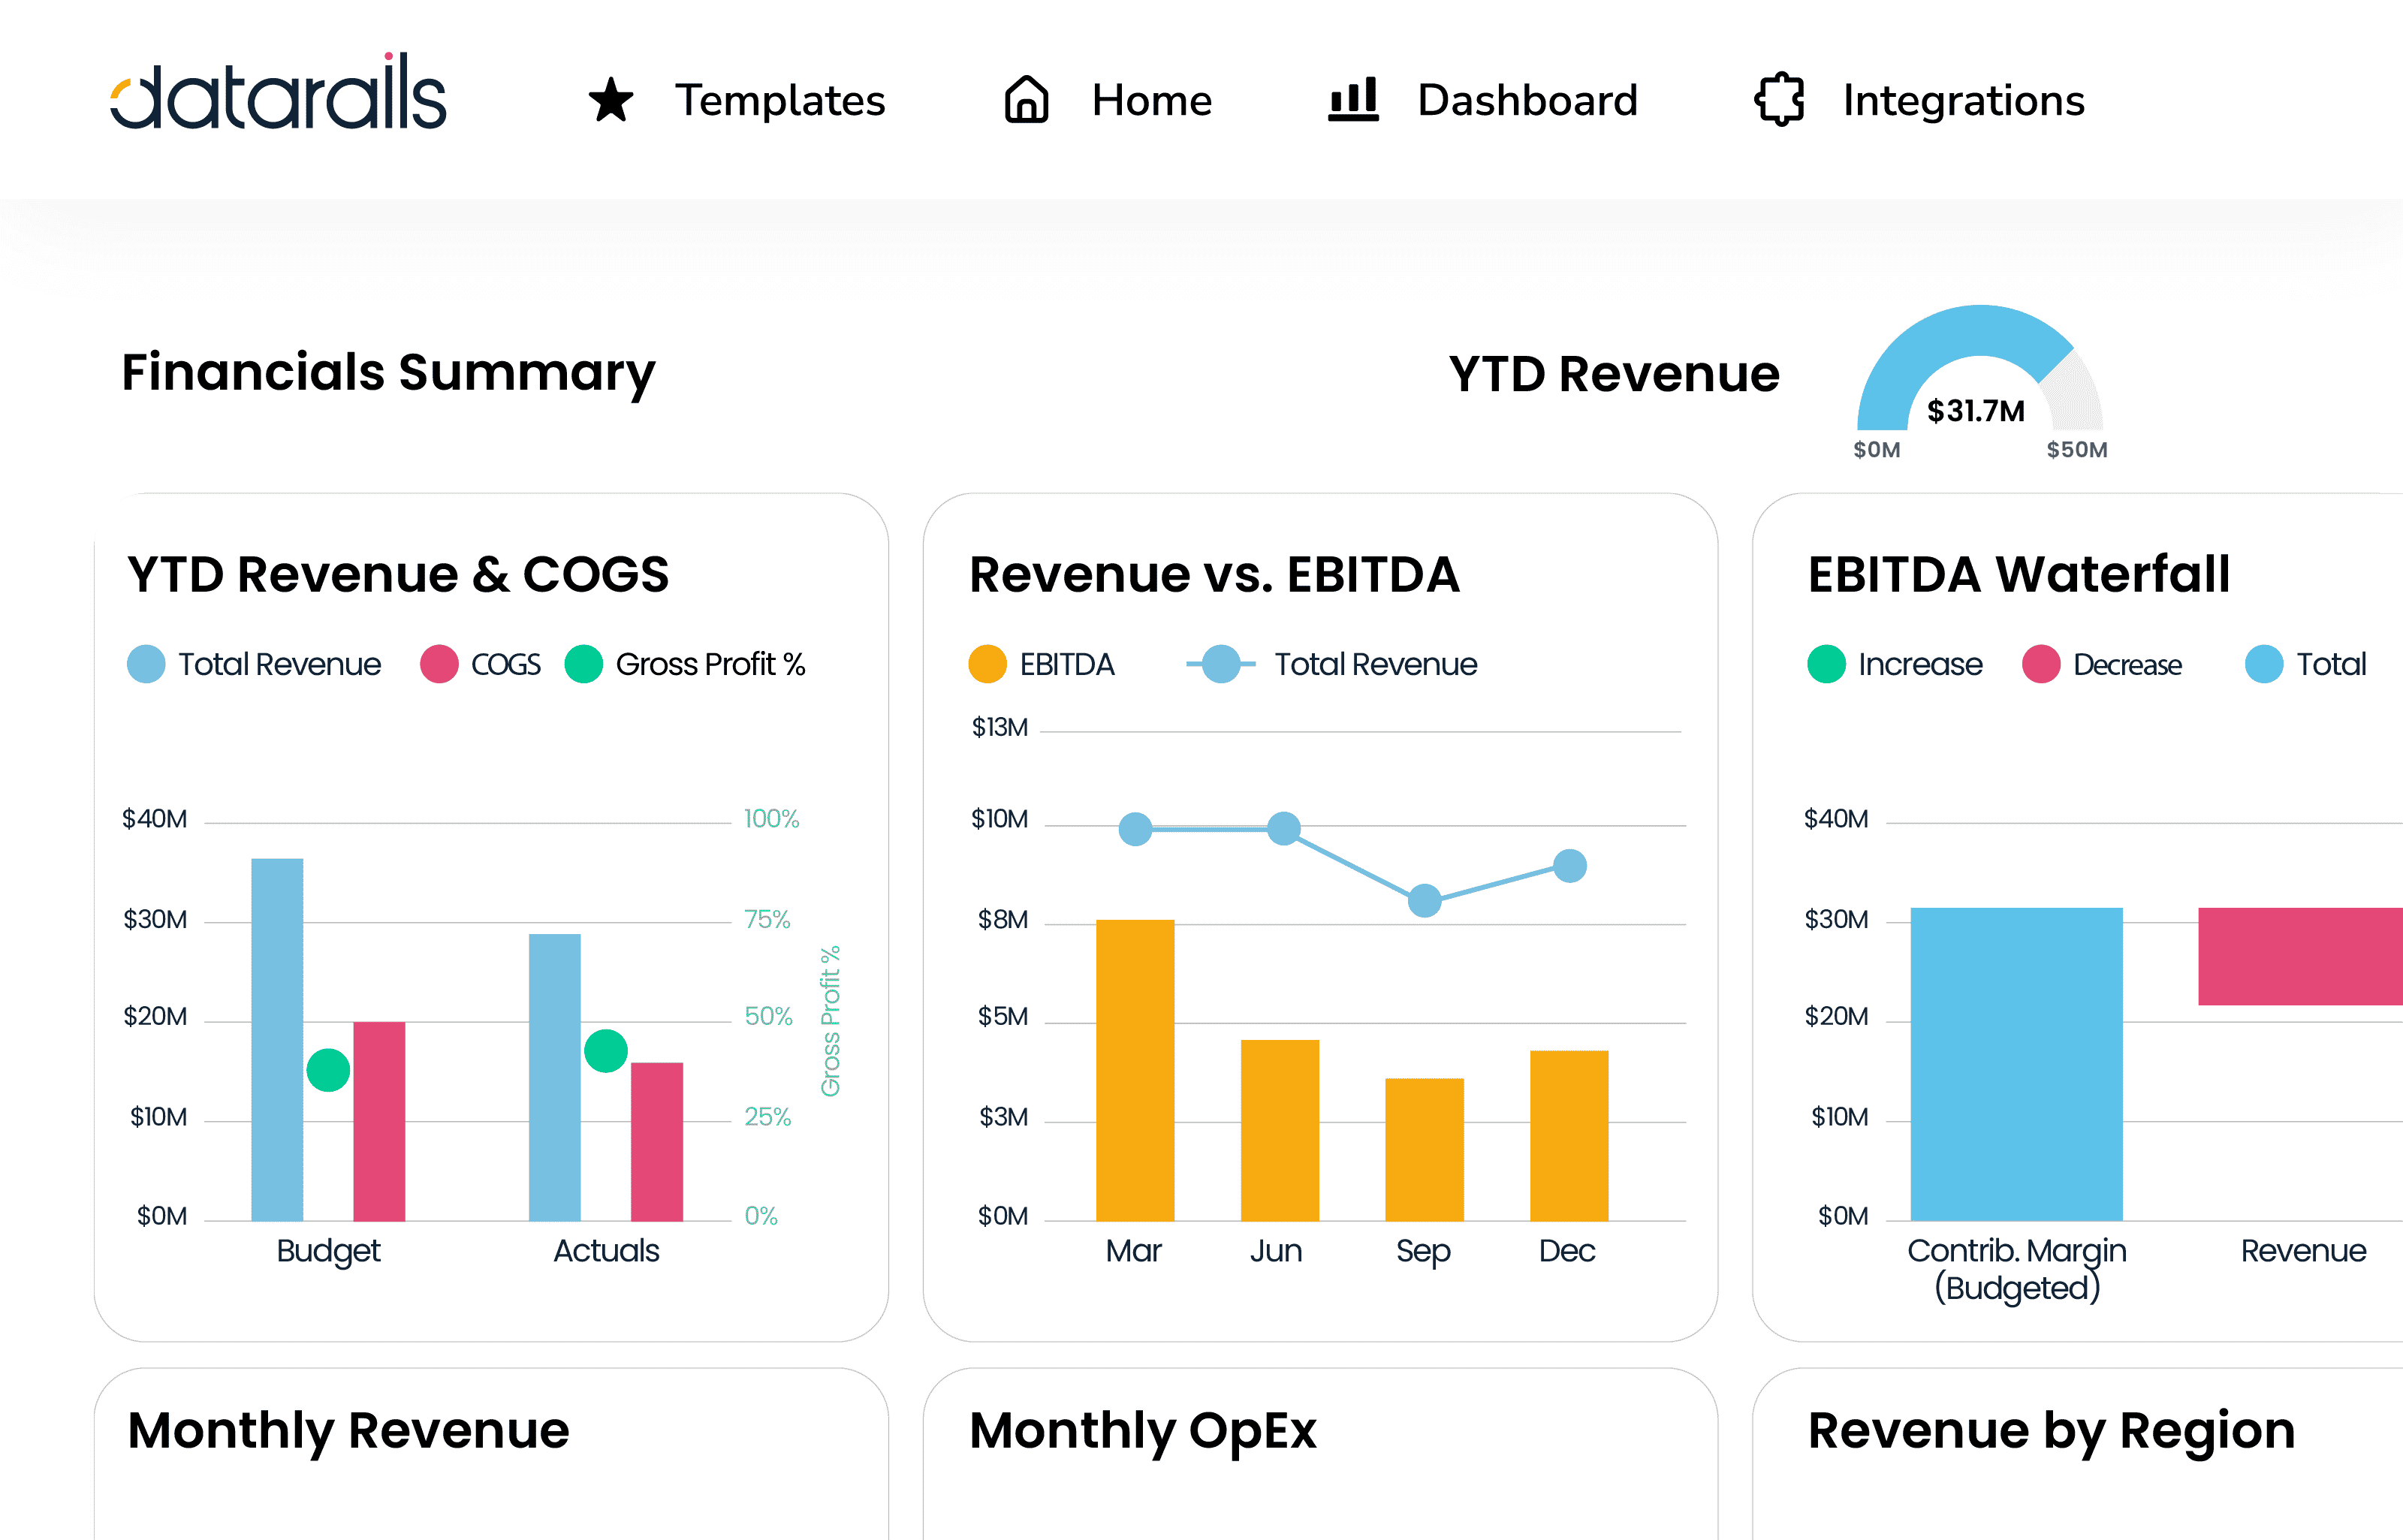
Seeing the numbers in a visual way makes it simpler to spot trends, variances and anomalies, and inspires business decisions based on data from across the company

Show stakeholders the business-critical KPIs at a glance
You might live in your spreadsheet, but not everyone does. Let your data tell the story, and answer questions on the spot by drilling down into real-time dashboards or PowerPoint management packages that are fully integrated with your data sources.

“We’re able to see trends that otherwise would have taken us hours and hours of work – or we just wouldn’t [see the trends] because we wouldn’t necessarily think about it.”

CFO, Montreal Mini-Storage


Improve decision-making on the finance team and beyond
• Build a fast track for business insights by creating or adjusting real-time dashboards on your own
• Share dashboards with other teams, empowering them to make more informed decisions
• Easily learn how to use our customizable built-in visualization capabilities, or integrate with other BI tools